Bitcoin is approaching a key milestone at $70,000 — a level analysts believe could mark the end of the current correction phase within the ongoing bull market. This comes as a major technical indicator hits a new low.
In an analysis posted on platform X on April 7, renowned trader and analyst Rekt Capital suggested that the BTC/USD pair might be nearing a bottom, close to the all-time high recorded in 2021.
Historical data indicates that $70,000 could serve as a critical level signaling the end of a downward trend. According to Rekt Capital, Bitcoin may continue correcting to this price zone before bouncing back, all while staying on track with its historical growth trajectory.

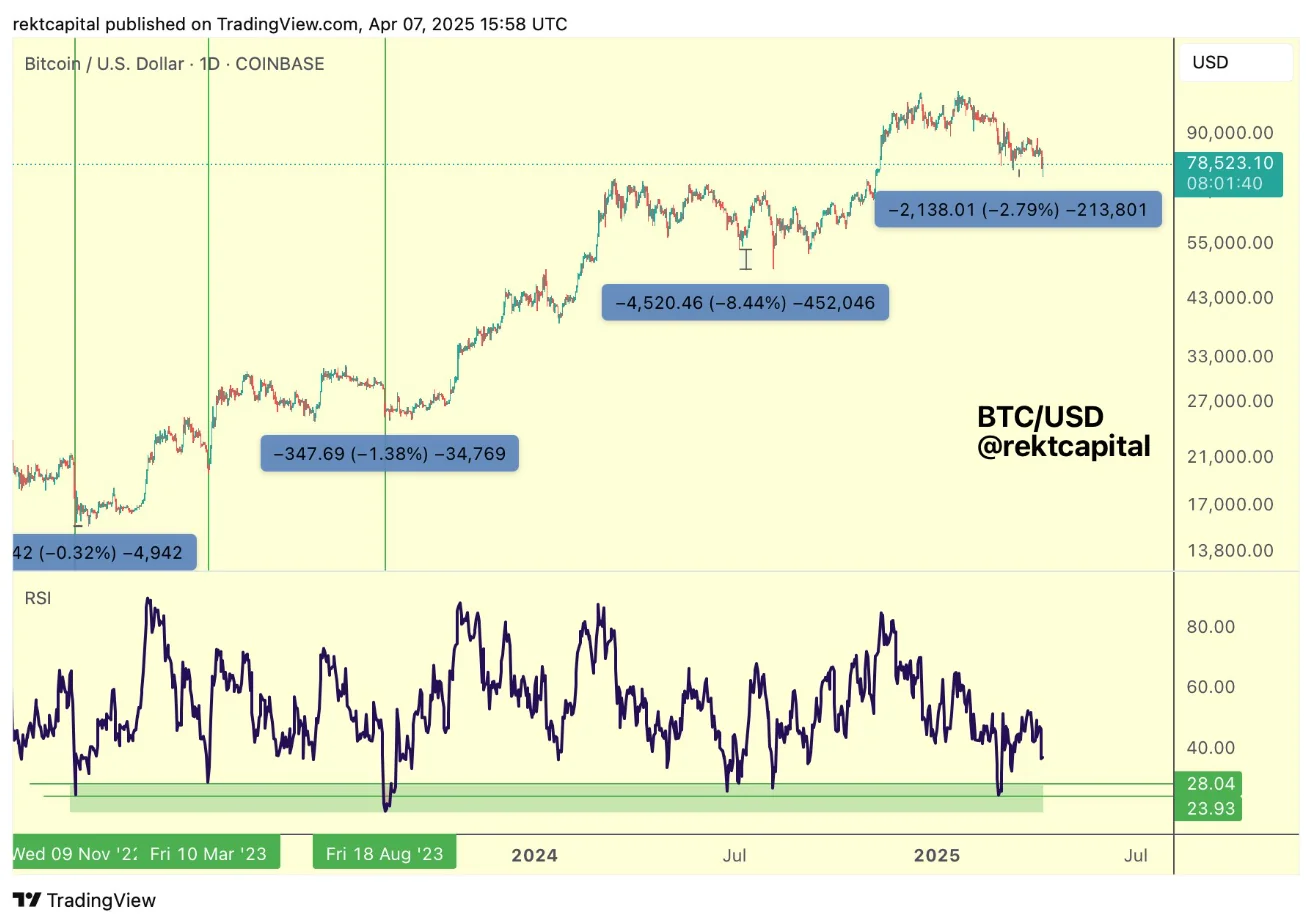
To support his forecast, he used the Relative Strength Index (RSI) to estimate Bitcoin’s potential downside.
“Whenever Bitcoin’s daily RSI drops below 28, it doesn’t necessarily mean the price has bottomed. In fact, historical data shows that the actual bottom tends to be 0.32% to 8.44% lower than the price at the RSI’s lowest point,” he explained.
At present, Bitcoin appears to be forming a second low, 2.79% lower than the first. In a more bearish scenario, a further 8.44% drop from the first low could bring BTC down to around $70,000, Rekt Capital noted.
The RSI is considered a leading indicator that often signals potential reversals before a clear price trend change occurs. Key RSI thresholds — 30, 50, and 70 — carry strong implications: an RSI below 30 signals an “oversold” market, while above 70 indicates “overbought” conditions.

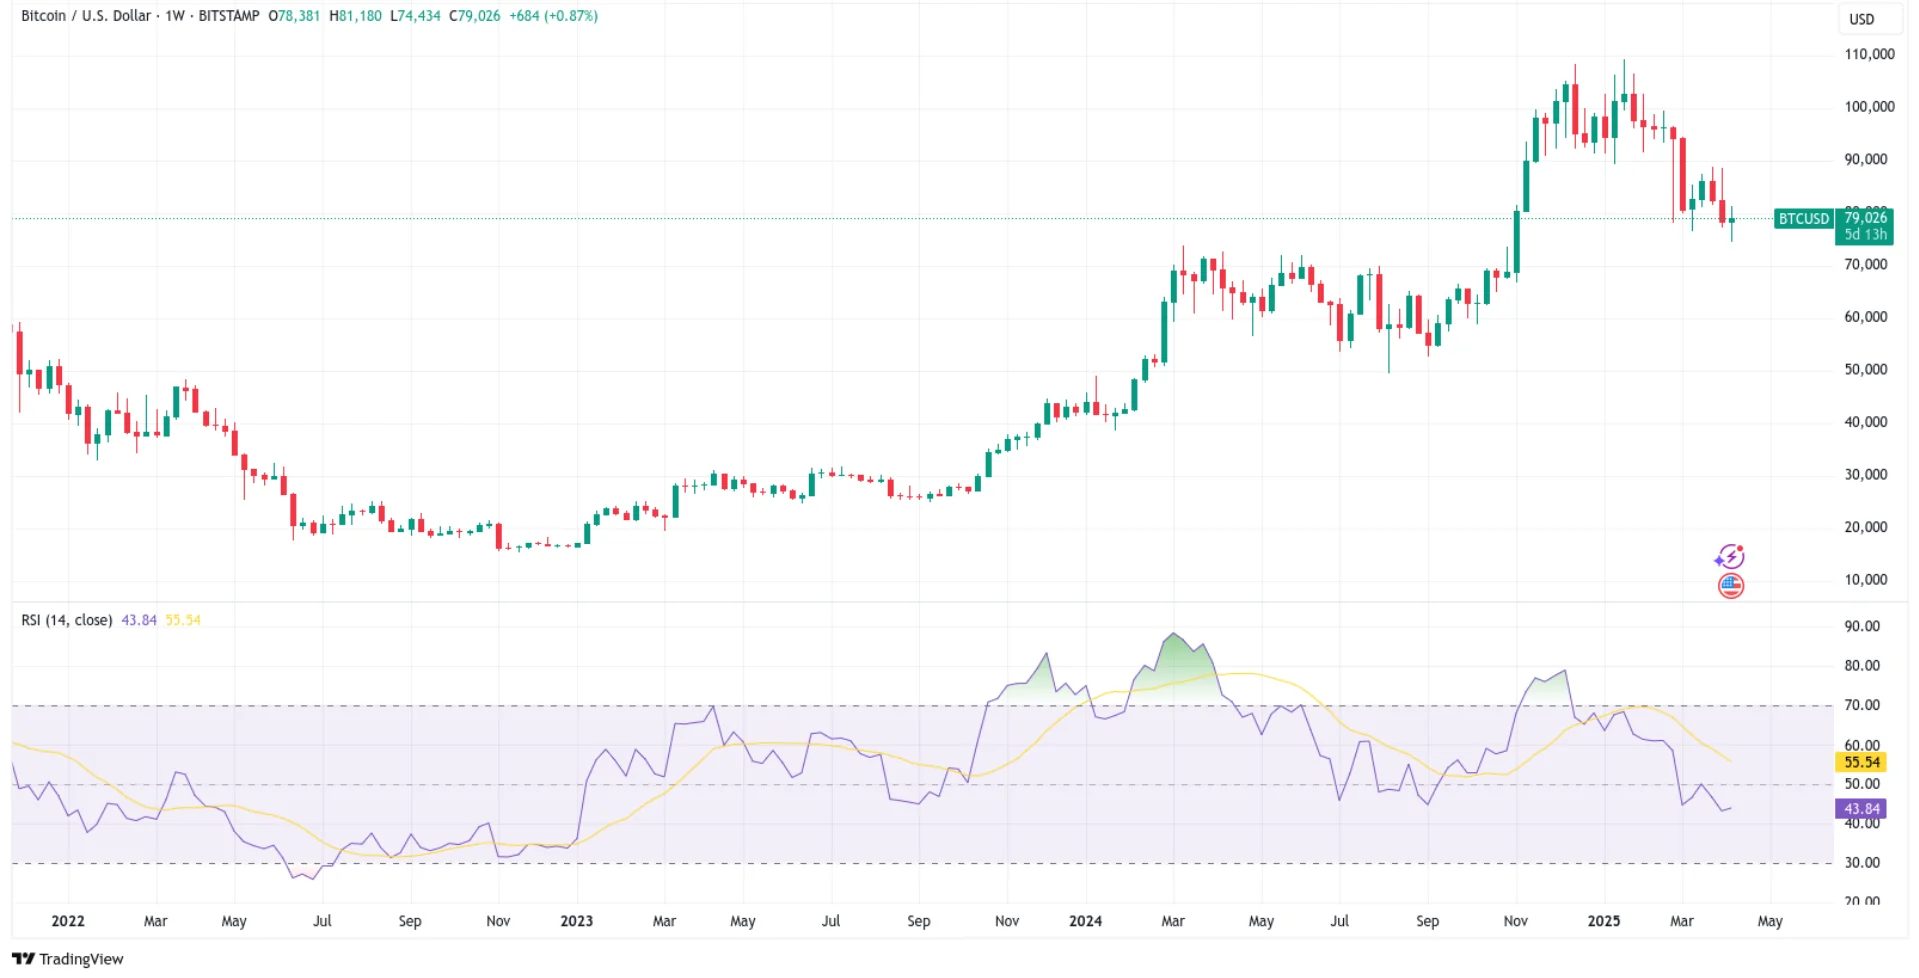
Currently, Bitcoin’s daily RSI is hovering around 38, after slipping from the 50 level. On the weekly chart, the RSI stands at 43 — the lowest since the bull market began in early 2023.
However, Rekt Capital emphasized that Bitcoin doesn’t necessarily need to hit $70,000 exactly to form a long-term bottom.
“Based on the current RSI trend, any price in the range from now to around $70,000 could serve as the bottom of this correction phase,” he added.
The last time BTC/USD traded around $70,000 was in early November 2024. That level also marked Bitcoin’s previous all-time high during the last bull run, which ended three years ago.


