This week, the cryptocurrency market experienced increased selling pressure, starting with Bitcoin’s significant drop from $70,000 to $66,254—a 5% decline. This downturn interrupted the recovery momentum of most major altcoins, raising the likelihood of further corrections. Meanwhile, Arbitrum’s price analysis reveals a 1.38% drop today to $0.69, indicating a substantial reversal from critical resistance levels.

Arbitrum Price Analysis: Could the Falling Wedge Pattern Initiate a Bullish Reversal?
The recovery momentum in the crypto market has faced considerable setbacks since last week, with Bitcoin struggling to maintain levels above $70,000. The resulting supply pressure has led to corrections in several key altcoins, including Arbitrum.
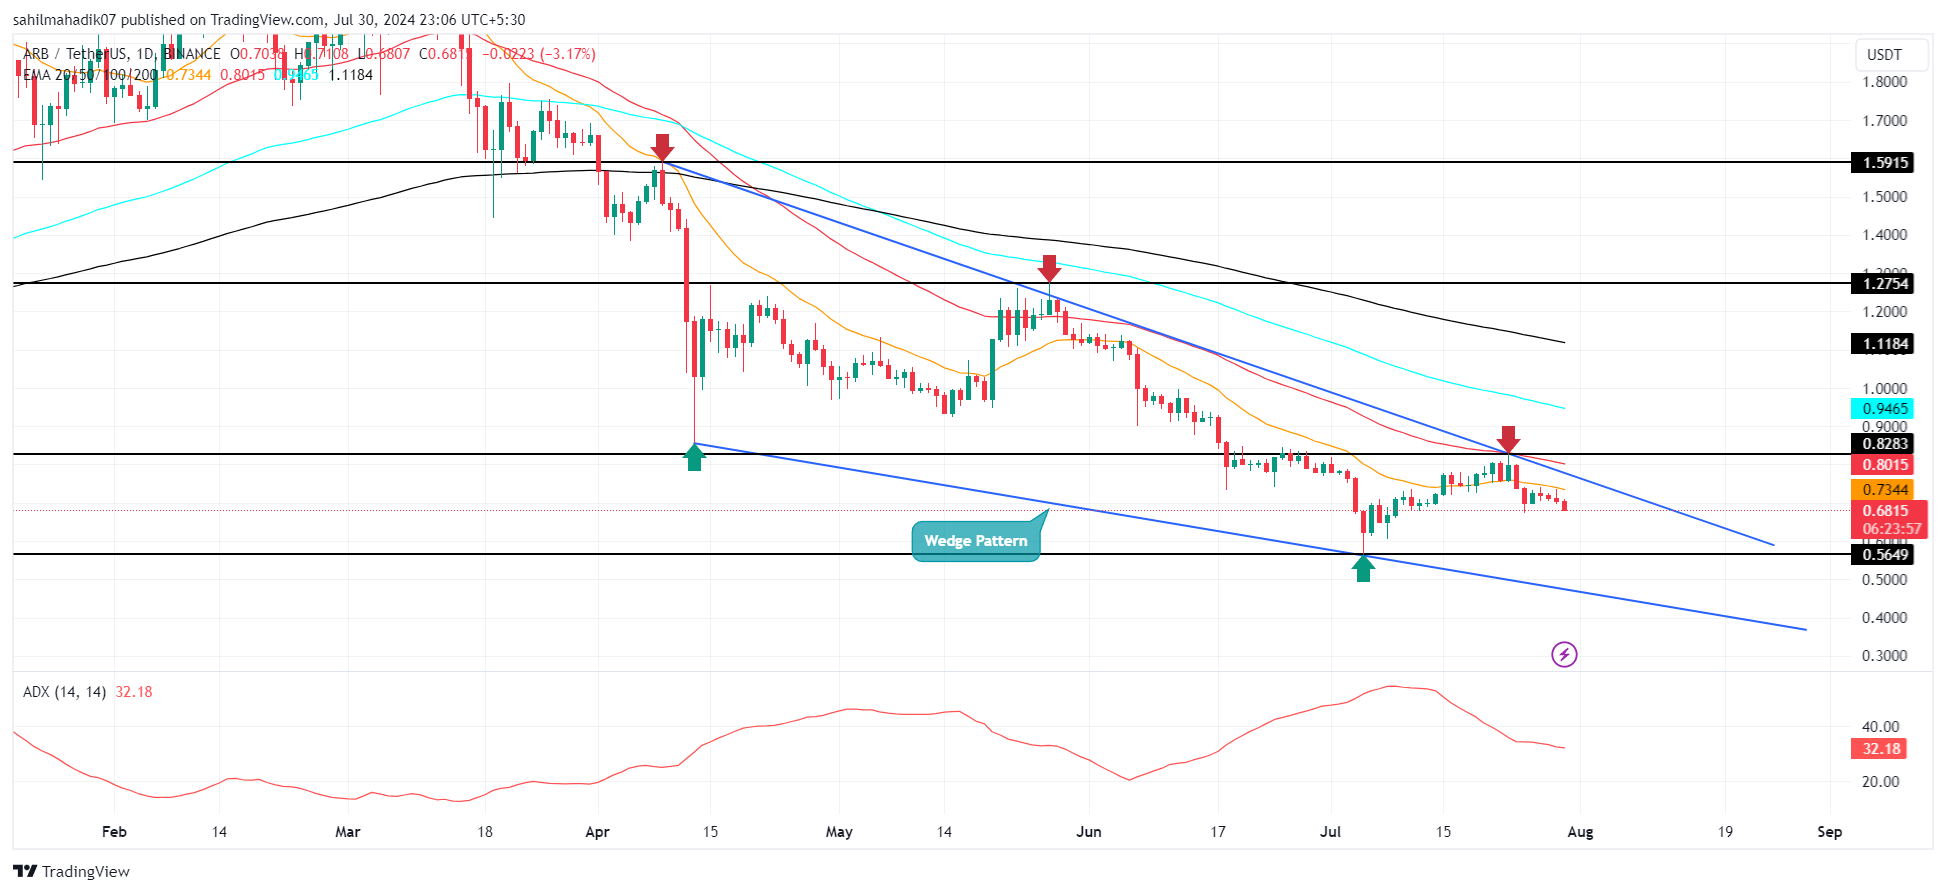
On July 23rd, Arbitrum’s price analysis showed a sharp reversal from the $0.828 resistance level, resulting in a 16.8% drop to $0.69. A closer look at the daily chart reveals this bearish cycle occurring within a falling wedge pattern. The two converging trendlines, which serve as dynamic resistance and support, have directed a downtrend since April 2024. Additionally, the coin’s price trading below the daily EMAs (20, 50, 100, and 200) suggests that the path of least resistance continues downward.
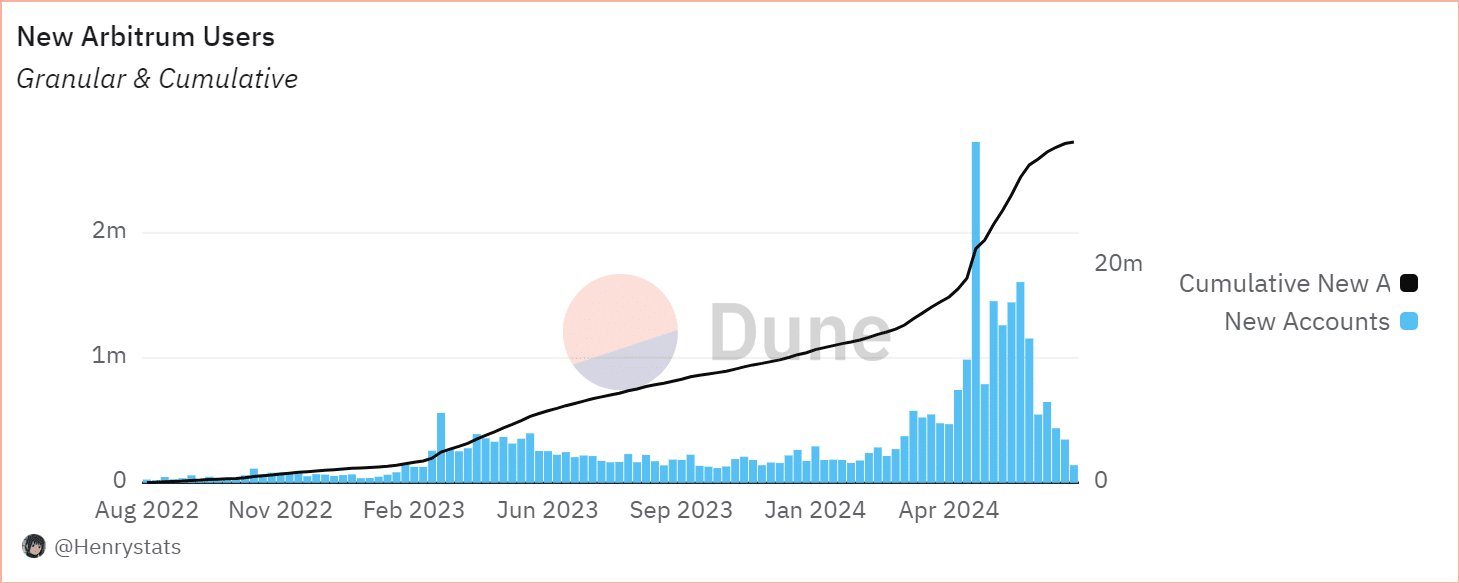
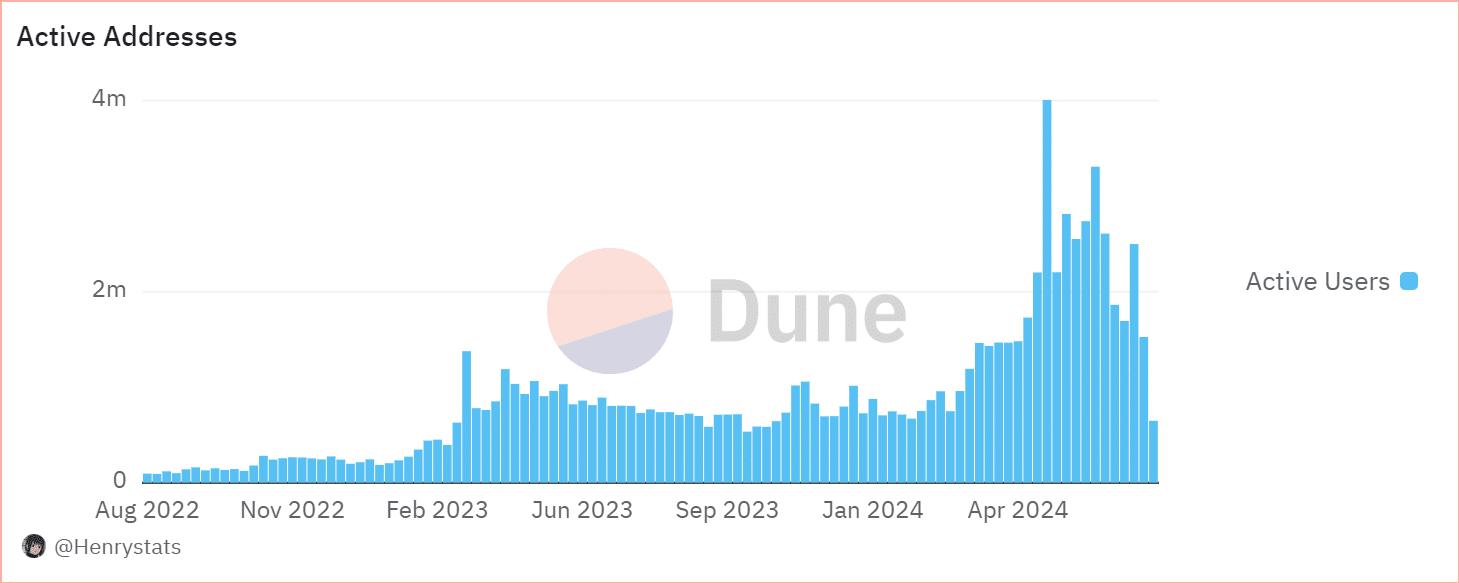
According to data from Dune Analytics, the Arbitrum network has seen a significant decline in active addresses over the past three months. From a peak of 4.01 million in May, the number of active addresses has plummeted to 648,200, marking an 83.84% decrease. A similar trend is evident in the influx of new users, with the on-chain metric dropping from 2.7 million to 181,600—a 93.27% reduction.

This considerable drop in both active and new users indicates a decreasing interest or a shift in the user base, which could impact network activity and affect the valuation of assets within the ecosystem. If bearish momentum continues, Arbitrum’s price analysis suggests a 16% downside risk, potentially retesting support at $0.565, followed by $0.46.
Conversely, the falling wedge pattern is a bullish reversal pattern that could encourage buyers to challenge the overhead trendline. A potential breakout would boost buying momentum and could drive the asset back up to $0.24.


